Getting Started and Account Management#
Discover the ease of autonomous analysis!
Thermal inspection significantly contributes to the effective execution of maintenance activities in PV plants with its high accuracy and rapid detection capabilities. This approach offers up to 99% time savings compared to traditional methods, maximizing the efficiency of PV plants and significantly reducing operational costs. This allows us to take a crucial step toward achieving our goal of enhancing sustainability and efficiency in the energy sector.
Platform Login#
MapperX is a comprehensive web software designed to effectively manage maintenance activities of solar power plants (PV) with thermal inspection, high accuracy, and rapid detection capabilities. This platform offers up to 99% time savings compared to traditional methods, maximizing the efficiency of PV plants and significantly reducing operational costs. Developed to enhance sustainability and efficiency in the energy sector, MapperX stands out with its user-friendly interface.
User and Company Management
- Create Account: The first step to access the platform is to create a user account at https://app.mapperx.com.
- Create Company: After logging in with your user account, you can add the company you want to manage to the platform.
Plant Management
- Create and Manage Plants: You can include solar power plants belonging to your company in the system and have full control over these plants.
Order and Payment Processing
- Create New Orders: You can create new orders for maintenance and repair needs.
- Payment Processing: You can securely process payments for your orders.
Media and Project Management
- Upload Photos and Project Plans: You can upload photos and project plans related to your plants, storing all information in a central location.
Application and Integration
- BOS Components and MapperX Studio: You can customize using system-specific BOS components and perform detailed analyses with MapperX Studio.
- SCADA Software Integration (Coming Soon): Soon, real-time data monitoring and control will be available through integration with SCADA systems.
MapperX is continuously developed to simplify and optimize business processes in the energy sector. For more information and access to the platform, visit https://app.mapperx.com.
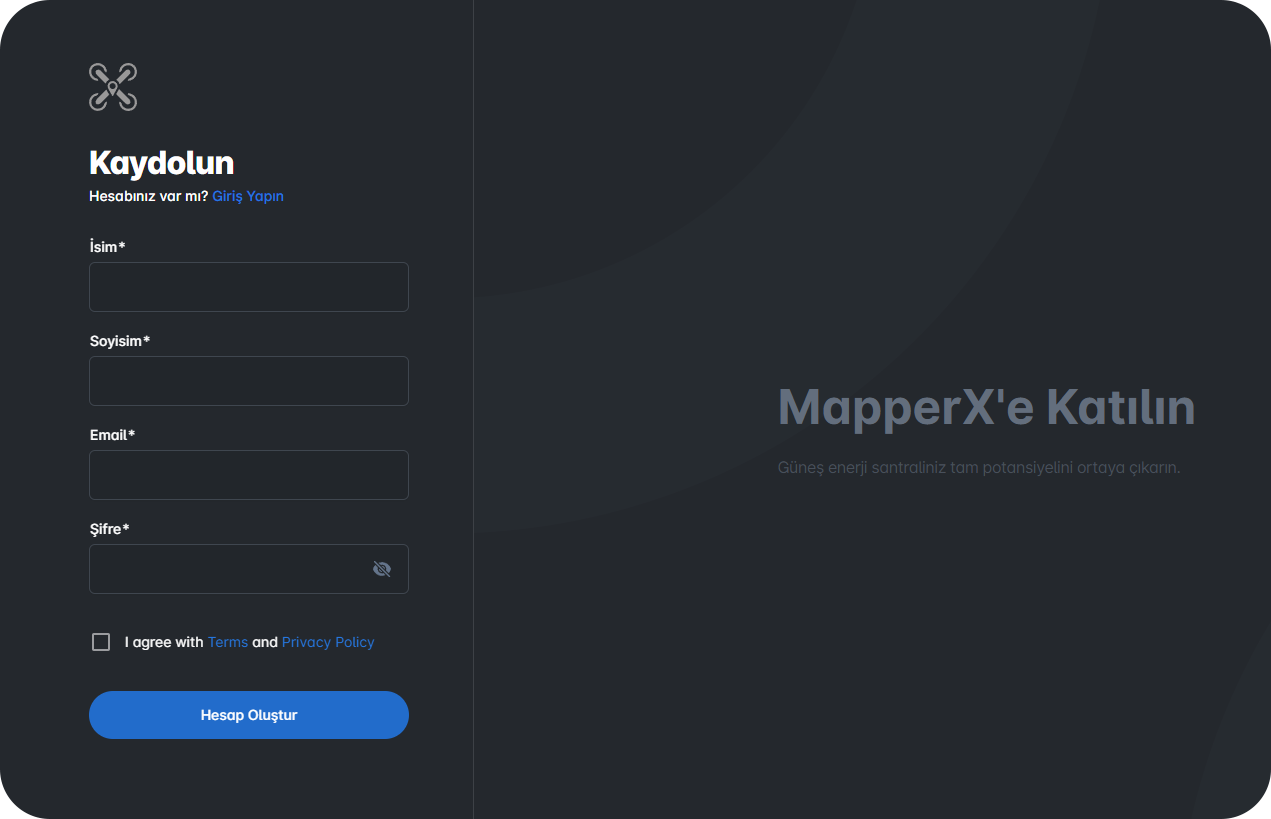
Create Account#
To create an account on the MapperX platform, the first step is to visit https://app.mapperx.com/register and fill out the registration form. During the registration process, you will need to provide some basic information:
- First and Last Name: Enter your real first and last name.
- Corporate Email: You must use a corporate email address associated with your company. This ensures that transactions on the platform are conducted with professionalism and reliability.
- Password: Create a strong password. Your password is a crucial element in securing your account.
During registration, you will also need to accept the following terms:
- Privacy Policy: Understand and agree to the platform’s data protection and privacy policy.
- Terms of Use: Read and accept the platform’s terms of use. These terms are set to ensure the healthy and effective use of the platform.
Please note that registrations from users without a corporate email address may be evaluated and approved or rejected at MapperX’s discretion. This is a measure to maintain a professional environment for the business world.
Once these steps are completed, you can enjoy a personalized experience on the platform. You will gain access to tools designed to enhance efficiency and operational performance in the energy sector.
Account Preferences and Management#
On the MapperX platform, users can personalize and manage their own account settings. In the account preferences section, you can easily update personal information, change passwords, adjust notification settings, and more. These features are designed to enhance user experience and improve your activity on the platform.
Team Creation and Management#
On the MapperX platform, users can create teams for viewing, managing, and performing operational tasks for power plants, and assign specific roles to these teams. In this way, team members with different levels of authority can manage power plants more effectively and efficiently.
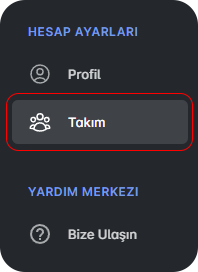
To access this feature, you can navigate to the “Team” tab in the main menu. From here, you can add team members, define their roles, and update these settings as needed.
Sub-User Creation#
New Sub-User Addition Process
- Role Requirement:
To add a new sub-user, you must first have the “Plant Manager” role. This role grants user management permissions and allows you to add new users to the platform.
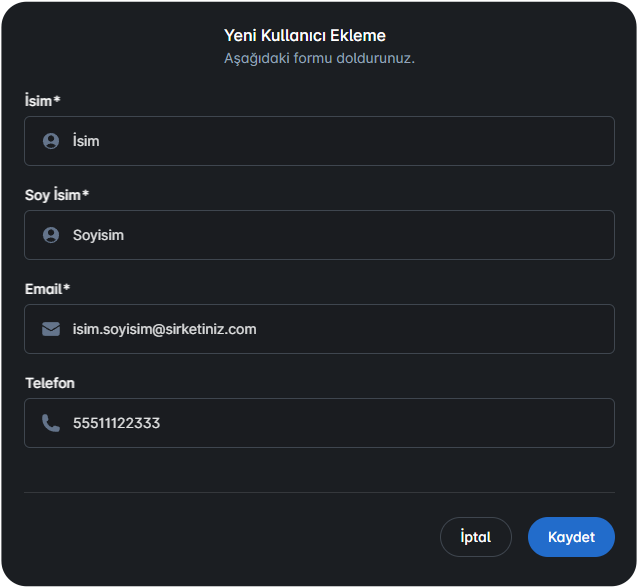
- Entering User Information:
When adding a new sub-user to the system, basic information such as the user’s first name, last name, email address, and phone number must be entered. This information is required to successfully integrate the user into the platform. 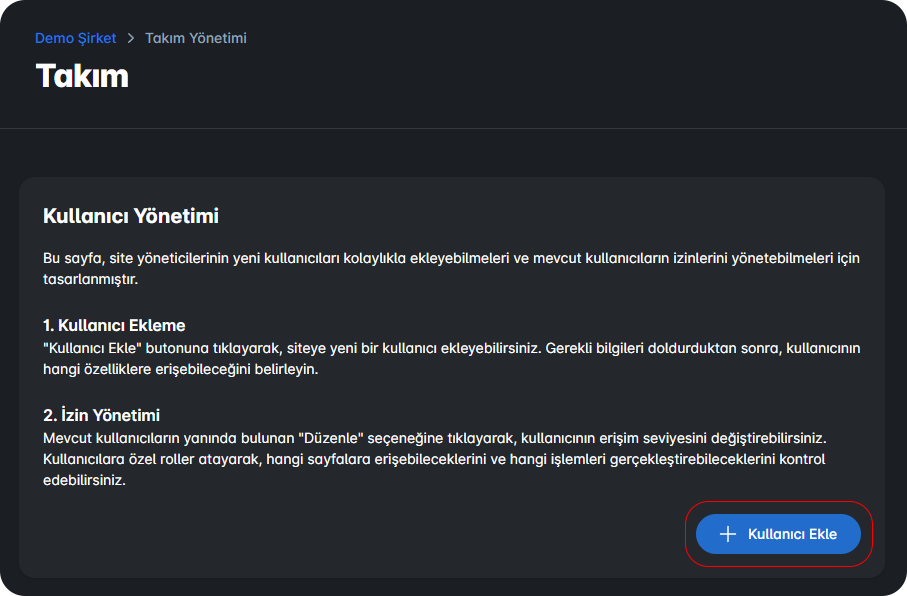
- Password Setup and Activation:
After the sub-user is created, a password setup email is automatically sent to the newly created user. The sub-user can access the platform by setting a password through this email.
These steps ensure that new users are smoothly integrated into the system and expand the management capacity of the Plant Manager. In this way, plant management can be carried out more effectively and systematically.
Sub-User Authorization#
On the MapperX platform, users with the Plant Manager role can grant various permissions to the sub-users they create. This authorization system ensures more effective and efficient management of power plants. Users can be edited via the Team tab in the main menu.
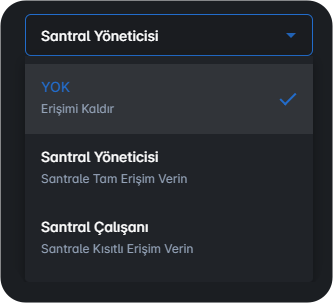
User Roles and Permissions
- Plant Manager:
- The Plant Manager has extensive permissions specific to a plant. Users in this role can view and manage all aspects of the plant. Additionally, they have access to key functions such as creating new sub-users, deleting users, accessing efficiency reports, and assigning tasks. The Plant Manager assumes full management responsibility for the plant and plays a critical role in operational processes.
- Plant Operator:
- The Plant Operator has more limited permissions, focusing on operational tasks at a specific plant. Users in this role can view anomaly and error information related to the plant, use the panel serial number scanning module, and add electrical values. However, Plant Operators cannot access broader data such as efficiency reports or general reports. This role is designed to support daily operational tasks and ensure effectiveness in specific duties.
This authorization structure ensures that plant management processes are organized according to each user’s role, allowing each team member to use their abilities optimally and contribute to the overall efficiency of the plant. The Plant Manager manages this authorization process to optimize the team structure according to the plant’s operational needs.
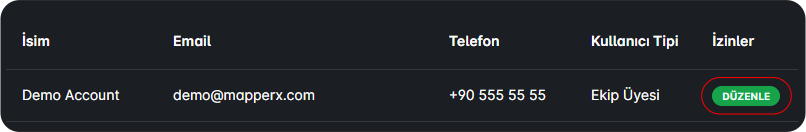
Sub-User Editing#
Sub-users associated with a plant can be edited via the Team tab in the main menu using the Edit button. To edit sub-users, you must have at least the Plant Manager role.
- Viewing Existing Sub-Users:
- Steps to view the list of all sub-users registered on the platform
- Ability to review each sub-user’s current permissions and information
- Updating Sub-User Information:
- Steps to edit sub-user details such as name, surname, email address, and phone number
- Verification and saving of updated information
- Authorization Changes:
- Editing roles assigned to sub-users (e.g., Plant Manager or Plant Operator)
- Adding new permissions or removing existing ones
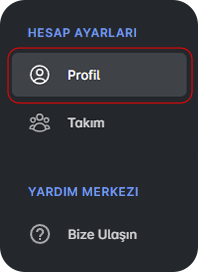
User Account Management#
Users can edit their profile information from the Profile tab in the main menu.
Profile Information
- First and Last Name: The user’s first and last name.
- Address: The user’s physical address information.
- Title: The user’s job title or position.
- Company: The user’s associated or employed company.
- About: A short description or bio about the user.
Contact Information
- Email: The user’s registered email address.
- Phone: The user’s contact phone number.
Updating this information helps users keep their accounts up-to-date and ensures they can interact with the platform using accurate contact details.
Platform Introduction and Usage#
MapperX is a platform designed to increase the efficiency of businesses. Through modules accessible from the main menu, you can easily manage personnel, track inventory, generate reports, and more. It is customizable to your needs and equipped with powerful reporting tools. Create your account and enhance your business’s productivity.
General Features#
MapperX is a platform developed for businesses in the energy sector. With modules including thermal inspection, efficiency reports, user management, and more, it simplifies the management of solar power plants for businesses. Thanks to its user-friendly interface, users can effectively manage their operations and improve productivity. MapperX is designed to help businesses achieve their sustainability goals.
Types of Anomalies and Anomaly Inspection#
The efficient operation and longevity of solar energy systems require regular monitoring and maintenance. In this process, detecting various anomalies that may occur in solar panels plays a critical role. Anomalies can reduce the efficiency of solar panels, leading to energy production losses. MapperX is an advanced software that uses artificial intelligence to detect these anomalies through thermal and RGB images.
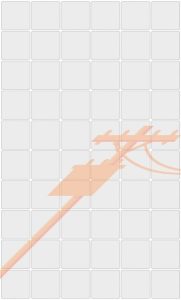
 | Cell Anomaly Cell anomalies are malfunctions occurring in individual cells of a solar panel. Thermal imaging can detect temperature differences in these cells. Abnormal temperature increases may indicate that the cells are operating inefficiently or are completely malfunctioning. These anomalies can negatively impact the efficiency of the cells and the overall panel performance. |
 | Multi-Cell Anomaly Multi-cell anomalies are collective malfunctions occurring in multiple cells. Thermal inspection can show these cells overheating together. This usually stems from connection issues between cells or manufacturing defects. Multi-cell anomalies can affect large parts of the panel, significantly reducing energy production. |
 | Diode Issues Diodes are components in solar panels that ensure unidirectional current flow. In thermal images, diode failures usually appear as overheating. Faulty diodes can prevent other parts of the panel from functioning efficiently, leading to energy production losses. |
 | Multi-Diode Issues Failures in multiple diodes can cause significant heating issues in the panels. Thermal inspections are used to detect these multi-diode failures. A large-scale diode failure can severely reduce panel performance and potentially disable the entire panel. |
 | Module Anomalies Module anomalies are problems observed in an entire solar panel module. Thermal imaging can reveal temperature differences between modules. These anomalies often result from manufacturing defects, installation issues, or environmental factors. |
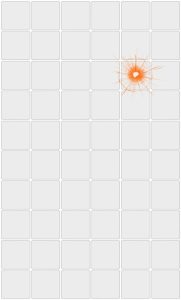
 | Hot Spot Hot spots are areas of abnormally high temperatures in specific regions of a panel. Thermal inspections can detect these areas, which are often caused by micro-cracks in cells or connection issues. Hot spots can shorten the lifespan of a panel and increase the risk of fire. |
 | Plant Shading Plant shading refers to energy loss caused by shadows from plants falling on solar panels. These shadows can be detected using RGB images. Shading reduces efficiency by obstructing energy production in certain parts of the panels. |
 | Contamination Contamination is the accumulation of dust, dirt, or other foreign materials on the surface of solar panels, causing energy loss. RGB images can be used to identify such contamination. Dirty panels reduce energy efficiency by not absorbing light properly. |
 | Shading Shading refers to energy loss caused by any object casting a shadow over the solar panels. RGB images are used to detect these shadows. Shading reduces overall efficiency by obstructing energy production in specific areas of the panel. |
 | Junction Box Issues Junction boxes are components that house the electrical connections of panels. Thermal imaging can detect overheating in these boxes. Overheating may indicate loose or damaged connections, leading to energy losses. |
 | Crack/Break Cracks or breaks are physical damages that occur on the surface of solar panels. RGB images are ideal for detecting such damage. Cracks or breaks compromise the structural integrity of the panel, negatively affecting energy production. |
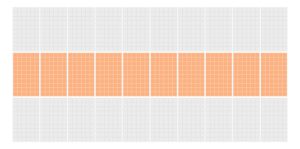 | String Issues String issues occur in strings where a group of panels is connected in series. Thermal imaging can detect temperature differences within the string. These issues often arise from cable connection problems or panel malfunctions. String issues can reduce the efficiency of the entire group. |
MapperX quickly and effectively detects these types of anomalies, optimizing the maintenance and repair processes of solar energy systems. This improves energy production efficiency and extends the system’s lifespan.
Anomaly Priorities#
MapperX
MapperX detects anomalies in solar panel systems using artificial intelligence algorithms and prioritizes these anomalies based on temperature levels and technical structures. This prioritization allows for the effective management of maintenance and repair processes. Anomaly priorities are evaluated at three levels: low, medium, and high.
Low Priority Anomalies 
- Pollution: Dust and dirt accumulation on the panels’ surfaces is considered low priority. These types of anomalies typically have a slight impact on panel efficiency and can be resolved through routine cleaning.
- Shading: Temporary shadows cast on the panels affect energy production for a limited time. Such shading is considered low priority and can generally be easily resolved through environmental adjustments.
- Plant Shading: Shadows caused by the growth of plants are of low priority. This condition can be kept under control with regular maintenance and plant pruning.
Medium Priority Anomalies
- Cell Anomalies: Temperature increases in individual cells are of medium priority. These anomalies can affect cell performance but typically do not severely impact the overall efficiency of the panel.
- Diode Issues: Diode failures can reduce panel efficiency by affecting current flow. Therefore, they are evaluated as medium priority and require timely intervention.
- Module Anomalies: Temperature differences observed at the module level are of medium priority. These anomalies may indicate manufacturing or assembly errors and should be managed with regular monitoring.
- Junction Box Issues: Overheating in junction boxes can affect the efficiency of electrical connections. These medium-priority issues should be monitored closely and addressed as needed.
High Priority Anomalies
- Multiple Cell Anomalies: The failure of multiple cells causes a temperature increase over a wide area of the panel and is of high priority. This situation significantly reduces panel performance and requires urgent intervention.
- Multiple Diode Issues: The failure of multiple diodes blocks current flow over a large portion of the panel, leading to significant energy losses. Therefore, they are assessed as high priority.
- Hot Spot: Hot spots occurring on the panels pose risks of structural damage and fire. These anomalies are high priority and require immediate intervention.
- Crack: Cracks or breaks in the panels can cause serious structural damage and significantly reduce energy production efficiency. Therefore, they are considered high priority.
- String Issues: Failures in series-connected panels affect the performance of the entire string. These issues are high priority and should be resolved quickly.
MapperX, this prioritization system optimizes maintenance and repair processes, ensuring that solar energy systems operate at maximum efficiency. Correctly prioritizing anomalies minimizes energy losses while extending system life.
Temperature Measurement and Information#
Temperature Measurement and Information
An important distinction to consider in thermal imaging technology is the difference between radiometric and non-radiometric data. Radiometric cameras have advanced sensors that provide accurate temperature measurements for each pixel and are therefore generally more expensive. In contrast, non-radiometric cameras only offer a visual comparison of temperatures and therefore lack the capacity for precise temperature measurements or consistent temperature comparisons between images. MapperX works exclusively with radiometric data to ensure high accuracy and reliability.
Thermal images captured using the WhiteHot color palette obtained from DJI drones provide high-resolution mapping of surface temperatures of objects. These thermal data are processed by artificial intelligence algorithms to be used for anomaly detection. The algorithms analyze anomalies in the temperature distribution and excessive temperature increases, allowing for early detection of potential failures and performance drops in solar panels.
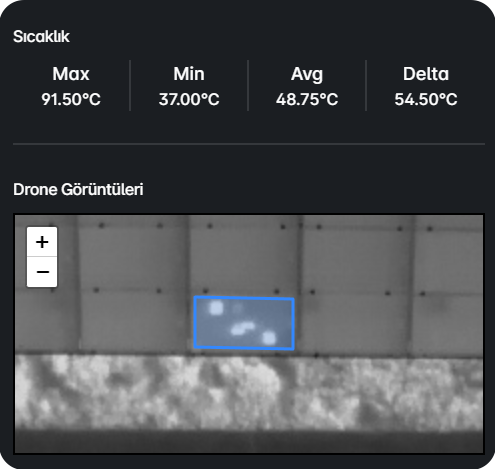
In studies on the importance of radiometric accuracy in thermal imaging, it has been shown that radiometric cameras measure with an average error margin of ±2°C, achieving an accuracy rate of over 95% in failure detection processes. This precision optimizes maintenance processes in power plants, increasing energy production efficiency while also ensuring cost-effectiveness.
In the MapperX Platform, data regarding the minimum, maximum, average, and deltaT (ΔT) temperature measurements for solar panels containing anomalies are provided as shown in the visual below. Anomaly priorities are determined based on temperature differences.
Power Plant View Filtering Features#
MapperX is software that detects faults in PV panels using artificial intelligence and offers the ability to filter the components in the power plant according to various criteria. These operations are performed on an RGB or thermal orthophoto map via a KML polygon network.
Map Type Selection
- Thermal Orthophoto: Shows temperature distributions.
- RGB Orthophoto: High-resolution visual map.
Show/Hide Components
- Inverters: Toggles the locations of inverters on the map.
- Transformers: Toggles the locations of transformers.
Error Types Filtering
- Cell failures, diode issues, module failures, hot spots, shading, pollution, junction box issues, cracks.
Error Causes Filtering
- Filtering of conditions causing anomalies.
Priority Filtering
- Filtering of anomalies by order of priority.
Temperature Bar Filtering
- Filtering according to specific temperature ranges.
Panel Performance Filtering
- Filtering according to the performance states of the panels.
Electrical Measurement Value Addition of the Panel#
The aim is to record current and voltage measurements of anomalous panels through field studies and to identify efficiency losses by comparing them with healthy panels on the same string.
- Measurement of the Anomalous Panel
- Field Study:
- Go to the location of the panel with detected anomalies.
- Measure the instantaneous current (A) and voltage (V) values of the panel.
- Data Entry:
- Log into the MapperX platform.
- Select the relevant panel and enter the measurement values on the entry screen.
- Note the date and time of measurement.
- Field Study:
- Measurement of the Healthy Panel
- Field Study:
- Select a healthy panel on the same string.
- Measure the instantaneous current (A) and voltage (V) values of the panel.
- Data Entry:
- Log into the MapperX platform.
- Select the healthy panel and enter the measurement values on the entry screen.
- Note the date and time of measurement.
- Field Study:
- Comparison and Analysis
- Data Screen:
- Compare the measurement values of the anomalous panel and the healthy panel on the platform.
- Display the measurement values of both panels in a table format.
- Reporting:
- Report the comparison results.
- Present the reasons for efficiency loss and suggestions.
- Data Screen:
Detailed Measurement and Recording Process
- Measurement Instruments:
- Use a direct current (DC) measurement instrument.
- Use a voltage measurement instrument.
- Regularly check the calibration of measurement instruments.
- Data Analysis:
- The MapperX platform automatically analyzes measurement data.
- Identify deviations in current and voltage values.
- Calculate the efficiency loss percentage of the anomalous panel.
Conclusion
The MapperX platform ensures the accurate recording and comparison of electrical measurement values of anomalous and healthy panels. Thus, efficiency losses in the panels can be detected, allowing for necessary maintenance and repair processes to be planned.
Panel Serial Number Addition#
MapperX platform allows the addition of serial numbers for panels to the system, which can be used in warranty, replacement, and digitalization processes.
Steps
- Accessing the Power Plant
- Log in to the MapperX platform.
- Select the Power Plants tab from the main menu.
- Find and click on the relevant power plant to enter it.
- Switching to Power Plant View
- On the power plant homepage, click on the Power Plant View option.
- Once the plant view is opened, locate the panels with detected anomalies on the map.
- Selecting Anomalous Panel
- Select the panel with an anomaly.
- The details of the selected panel will appear.
- Adding Serial Number
- In the panel details window, find the Serial Number section.
- Click on the barcode icon in this section.
- Adding Serial Number Using a Mobile Device
- When you click on the barcode icon, your mobile device’s camera application will open.
- Scan the serial number on the panel using your mobile device’s camera.
- Advanced OCR technology automatically recognizes the serial number and adds it to the system.
- Data Verification and Saving
- Check the serial number on the screen and confirm its accuracy.
- If the serial number is correct, press the Save button to complete the process.
- If the serial number is incorrect, repeat the process to enter the correct number.
Use Cases
- Warranty Process:
- Serial numbers are used to verify and manage warranty claims.
- Replacement Process:
- When faulty or anomalous panels need to be replaced, serial numbers accelerate and ensure the accuracy of the replacement process.
- Digitalization Process:
- The digital recording of serial numbers makes it easier to track the lifecycle and history of panels.
Conclusion
This documentation ensures the fast and accurate addition of serial numbers for anomalous panels in the MapperX platform, allowing effective management of warranty, replacement, and digitalization processes.
Central Efficiency Analysis#
Financial Loss Calculation#
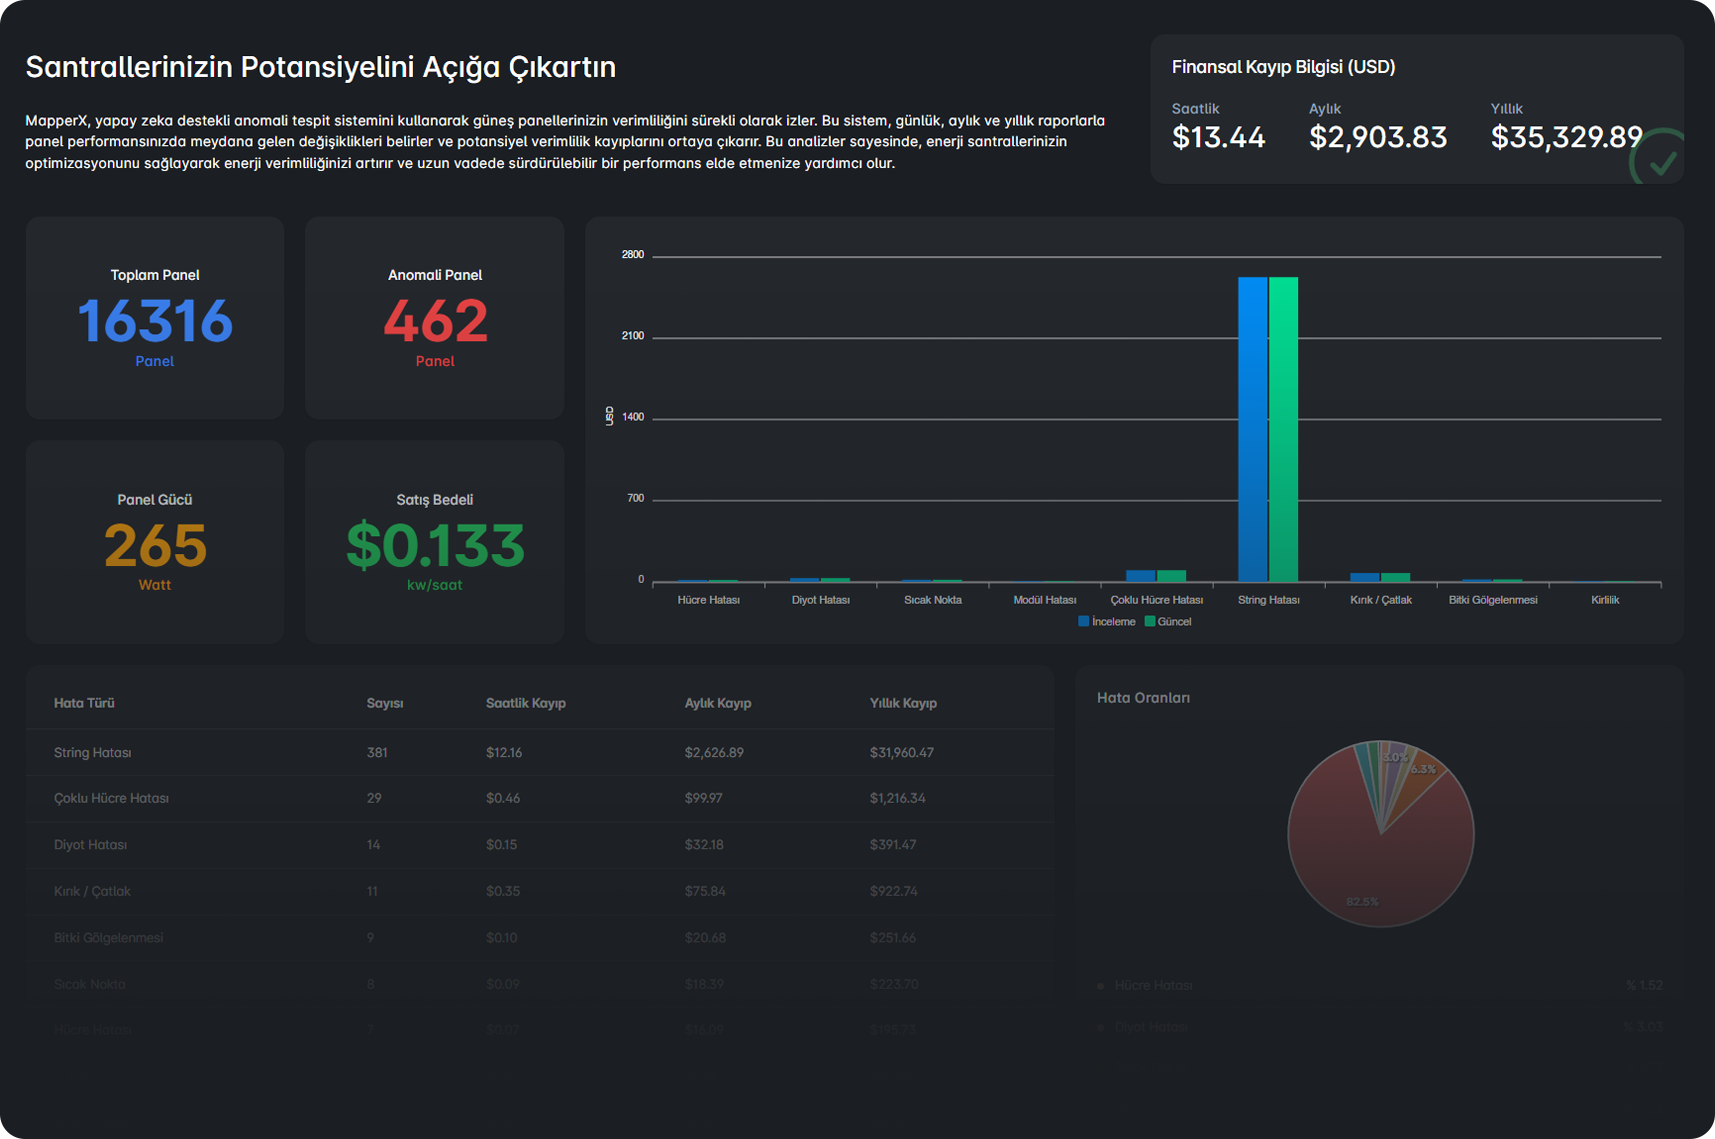
MapperX and Financial Loss Calculation
MapperX offers the ability to calculate the financial impacts of anomalies that occur in solar energy plants in relation to plant efficiency. These calculations are made according to the types and numbers of anomalies and are determined daily, monthly, and yearly based on the sales fee per kWh.
Calculation Process:
- Types and Number of Anomalies: Detected anomalies are classified according to their types and numbers.
- Energy Production Losses: For each type and number of anomalies, the amount of lost energy production is calculated.
- Financial Losses: Lost energy production is calculated along with the sales fee per kWh, and artificial intelligence algorithms determine the financial losses.
- Time Frames: These losses are identified separately as daily, monthly, and yearly.
Graphical and Written Reporting:
MapperX presents these financial loss calculations both graphically and in writing. Users can easily access the following information through the system:
- Graphical Reports: Graphical representations of energy production losses and financial losses according to time frames.
- Written Reports: Detailed text reports summarizing the losses incurred for each type and number of anomalies.
Data Collection and Processing#
MapperX provides an innovative and effective solution for data collection using unmanned aerial vehicles (Drones) and processing this data on the platform. This process plays a vital role in optimizing the performance and efficiency of your solar energy plants. The drone-supported data collection and processing system enables you to obtain data quickly, reliably, and with high accuracy, helping you assess the status of your energy plants in the best way possible.
Flight Planning and Data Collection#
For the Solar Thermography data product, visual (RGB) and thermal photographs are required. A drone pilot will use an unmanned aerial vehicle system (a drone with a camera) to capture the data in the field. The drones we support are the DJI Mavic 3 Enterprise Thermal, DJI Matrice 350 + H20T, and DJI Matrice 30 Thermal. Data collection will be carried out using these drones.
MapperX offers three different service packages for thermographic inspection. Please create an order based on the service package that suits you and plan your flight according to the data below.
Service Package Comparison
GSD Value (cm/pixel) | Detail Level | Flight Altitude (m) | Inspection Type |
10.0 ± 0.5 | Low | High | General Solar Module Inspection |
5.0 ± 0.5 | Medium | Medium | Cell and Cell Anomalies Inspection |
3.0 ± 0.5 | High | Low | Comprehensive Inspection in Accordance with IEC Standards |
- General Solar Panel Scan (10.0 ± 0.5 cm/pixel): Suitable for entry-level inspection and fast scanning of large areas. High-altitude flights provide a wide field of view but produce less detailed images.
- Solar Cell Anomalies Inspection (5.0 ± 0.5 cm/pixel): Ideal for detecting potential issues at the cell level with medium detail. This GSD allows even small anomalies in solar cells to be noticed.
- Detailed and Comprehensive Solar Inspection (3.0 ± 0.5 cm/pixel): This level is necessary for detailed thermal inspections and temperature measurements compliant with IEC standards. This GSD ensures that even the smallest anomalies on solar panels and cells are identified in accordance with internationally accepted standards.
| Feature | Starter | Professional | Enterprise |
| GSD | 10.0 ± 0.5 cm/pixel | 5.0 ± 0.5 cm/pixel | 3.0 ± 0.5 cm/pixel |
| Overlap | Front Overlap 70% Side Overlap 70% | ||
| Gimbal Orientation | Standard Nadir (-90 degrees) | ||
| Flight Path Direction | Along the short edge of the solar panel rows | ||
| Flight Area | A flight plan at least 2 rows beyond the boundaries of the solar panels | ||
| Image Format (Visual) | JPEG, each image includes GPS location, relative altitude, gimbal angle, gimbal direction, gimbal roll, and local timestamp | ||
| Image Format (Thermal) | R-JPEG or Radiometric TIF, each image includes GPS location, relative altitude, gimbal angle, gimbal direction, gimbal roll, and local timestamp | ||
| Image Quality | Visual: clear, free from motion blur and minimal glare; Thermal: clear, free from motion blur and minimal glare | ||
| Environmental Conditions | A clear blue sky should be targeted. If a cloud passes, wait for 10-15 minutes for the panels to heat up again. Consecutive flights should not exceed 25 minutes unless it is a new flight block. Wind speed should be below five m/s, and humidity should ideally be less than 60%. | ||
| Irradiation | ≥ 600 Watt/sqm | ||
This assessment shows that the correct selection of GSD and flight altitude has a significant impact on the accuracy and effectiveness of solar panel inspections. Choosing the appropriate GSD value and flight altitude according to the defined objectives optimizes costs and enhances the quality of the inspection. This makes the inspection process more efficient, ensuring that solar power plants operate at maximum performance.
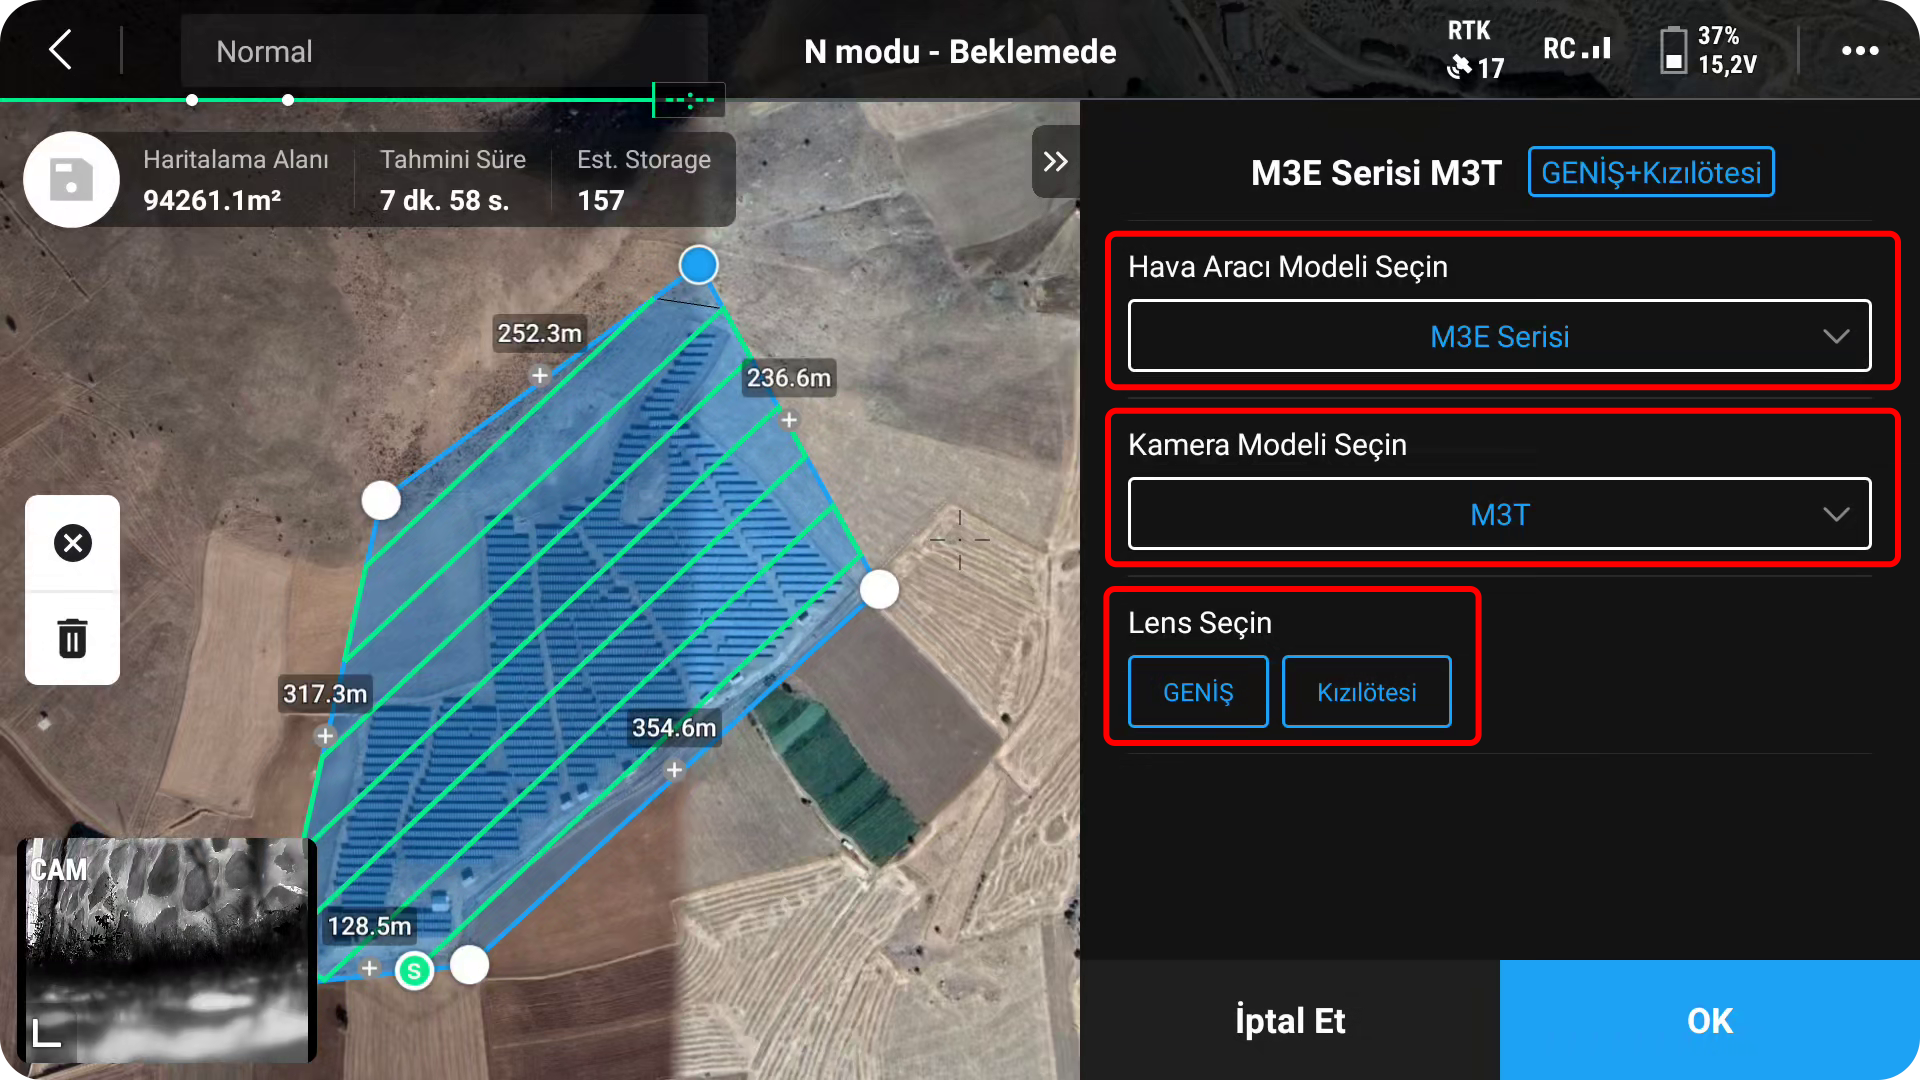
Flight Instructions Using DJI RC with DJI Pilot 2 Application
Logging into the DJI Pilot 2 Application:
- Open the DJI Pilot 2 application using the DJI RC remote control.

Camera Settings:
- Enter Camera View: Click the “Enter Camera View” button to access the camera settings section.
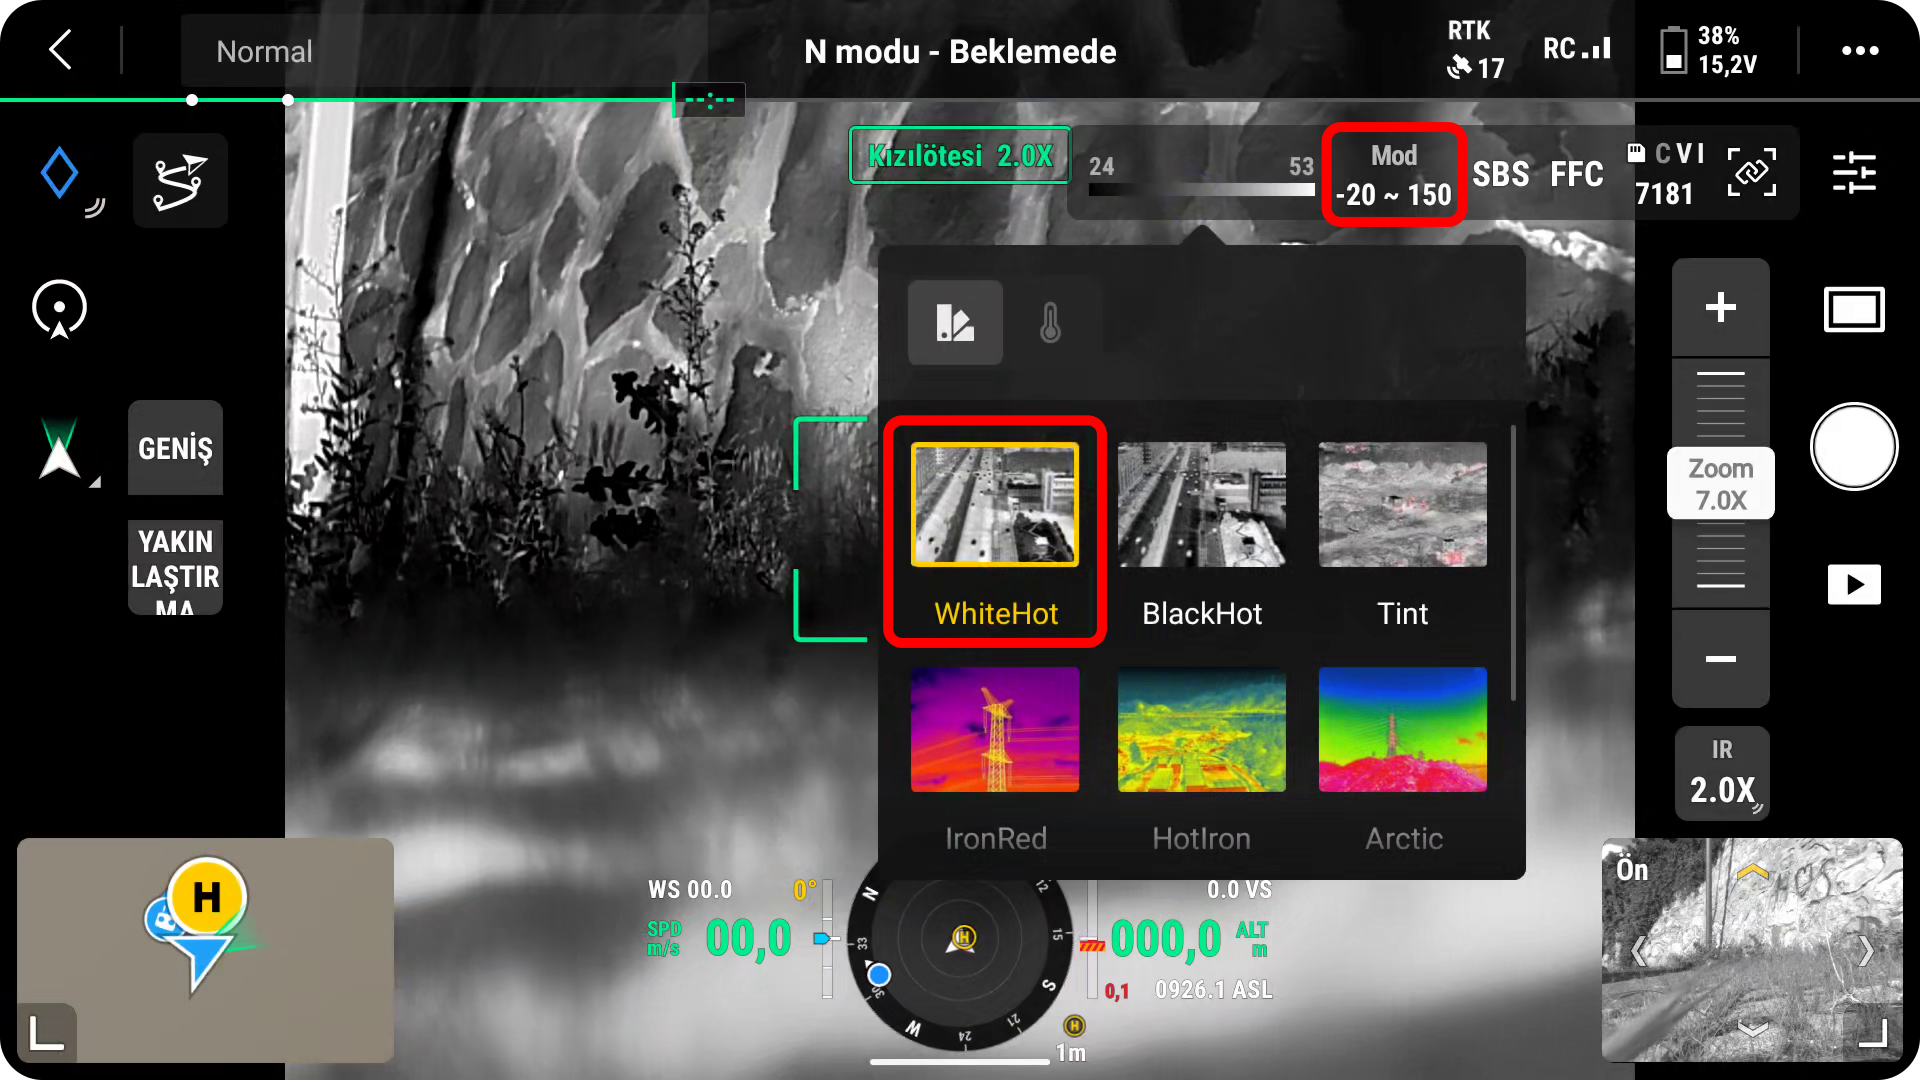
- Color Palette: Select the color palette as “WhiteHot” from the top right bar.
- Mode Selection: Set the mode as “Aerial Imaging.”
- Image Format: Select “Radiometric TIF” for thermal images and “JPEG” for visual images.
- Camera Parameter Settings: Go to “Camera Parameters” from the menu and adjust the settings as follows:
- Image Size: Select “3840 x 2160” (16:9).
- Frame Rate: Select “30 fps.”
- Image Settings: Adjust the settings according to the following parameters:
- ISO: 200.
- Shutter Speed: 1/2000.
- White Balance: Auto.
- Return to the Main Screen: Click the back arrow in the upper left corner to return to the main screen.
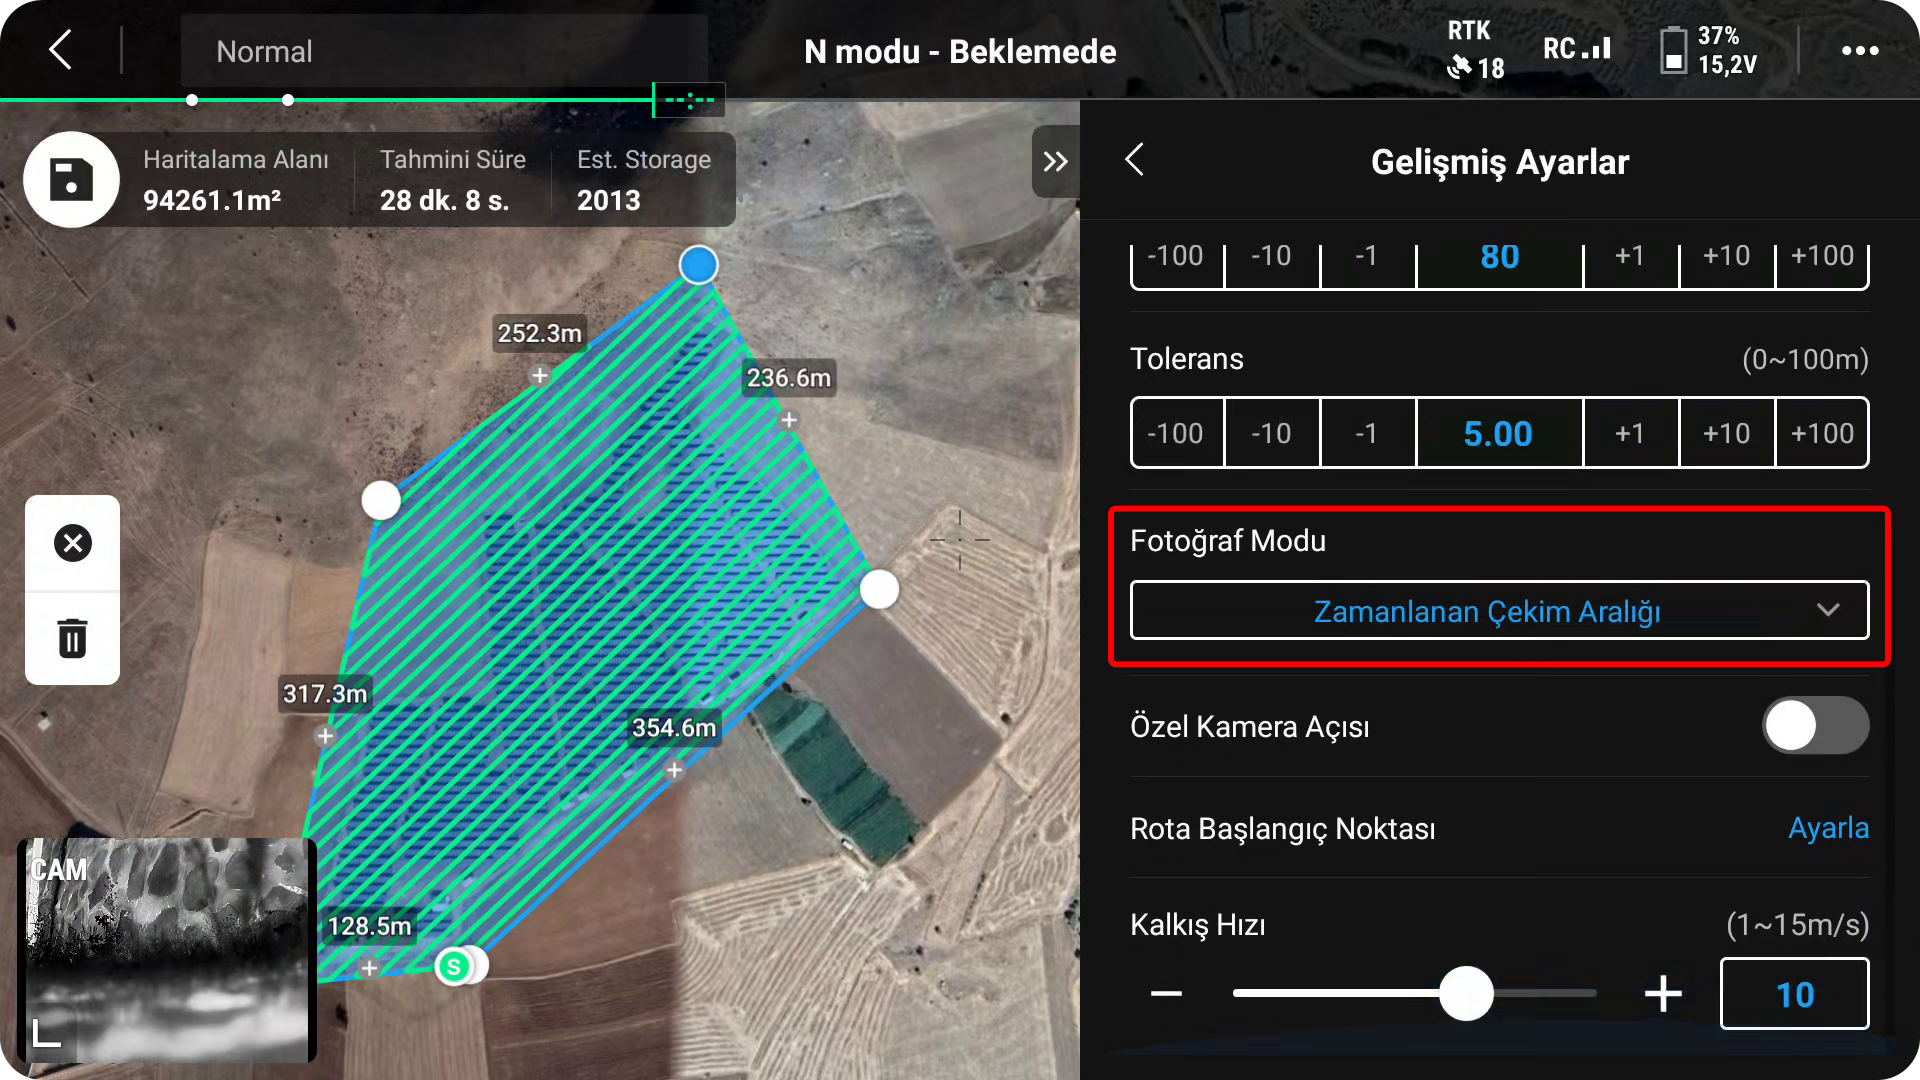 Flight Route Settings:
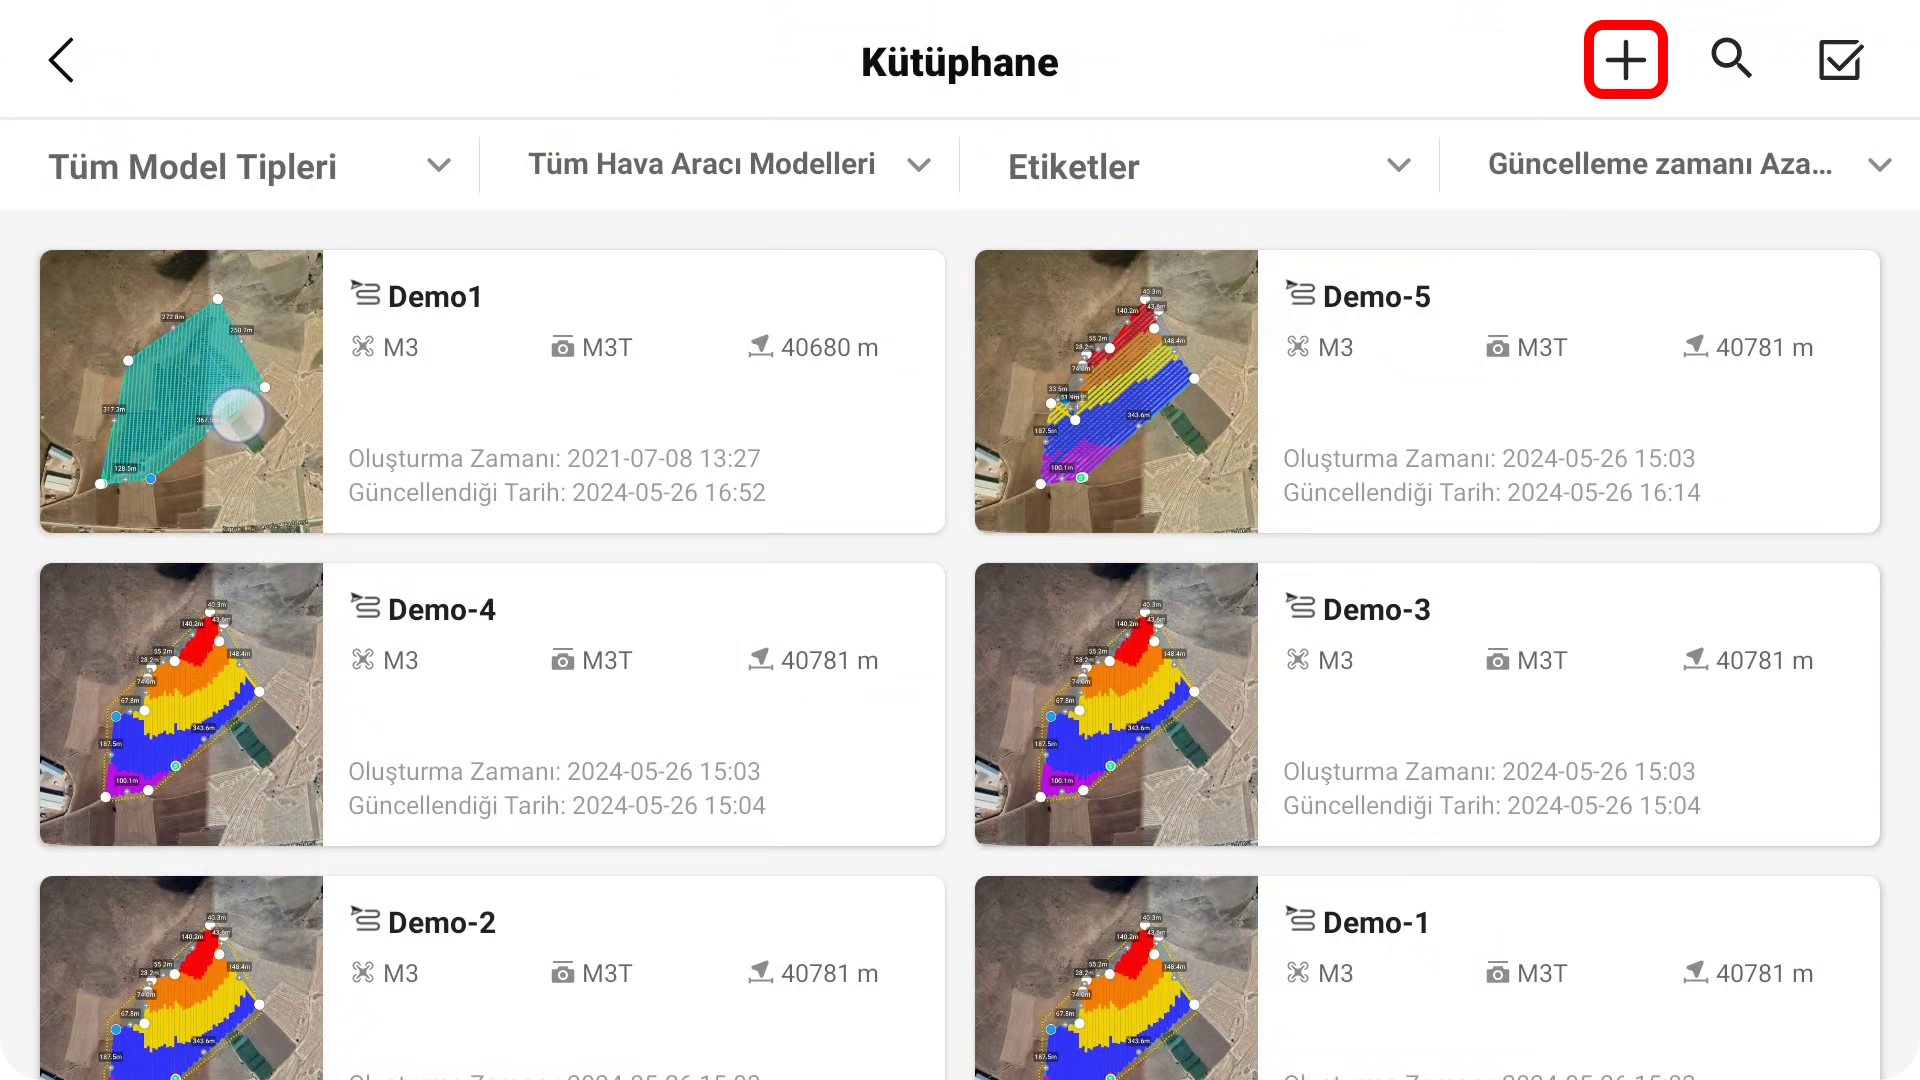
- Click the “+” button in the upper right corner to set the flight route.
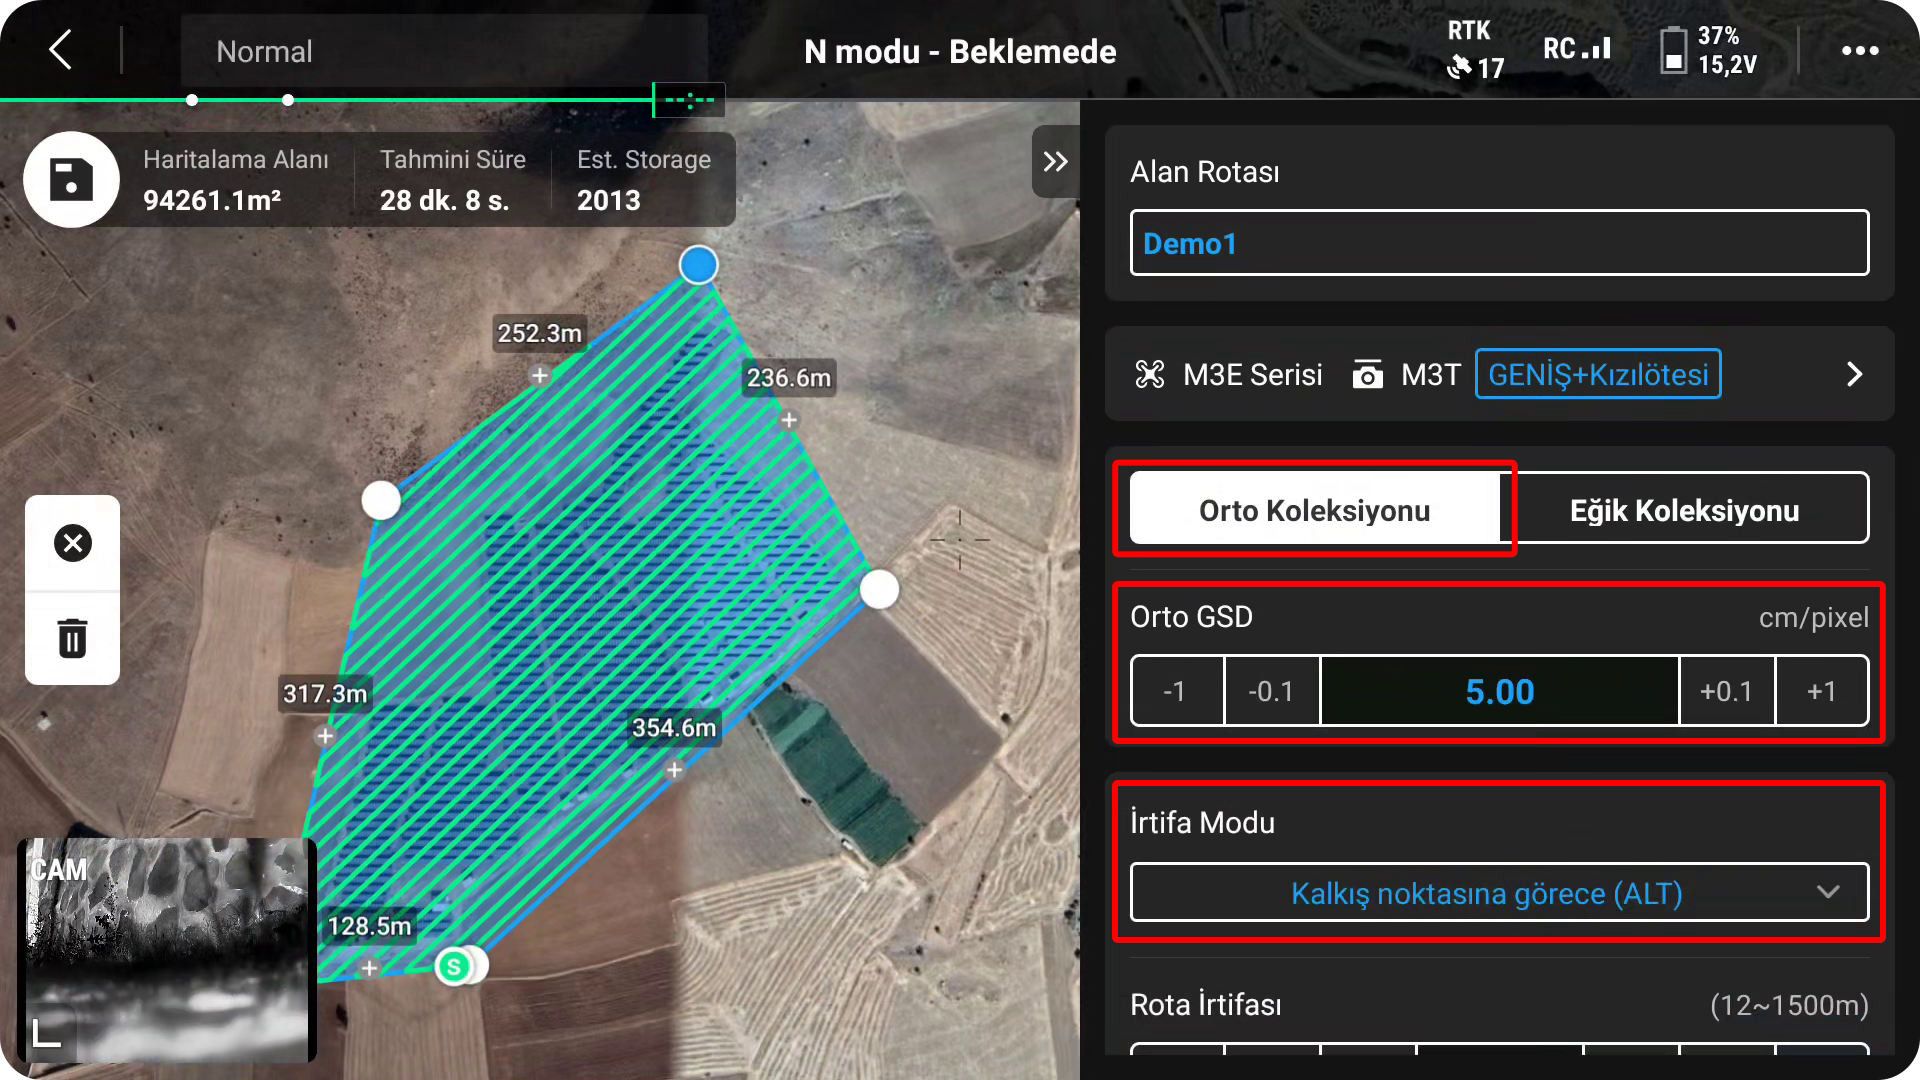
- Select “Map.” Select the mission type as “Photogrammetry.” Set the “Flight Height” according to the selected service package.
- Plan your flight by determining the boundaries. Draw the flight area.
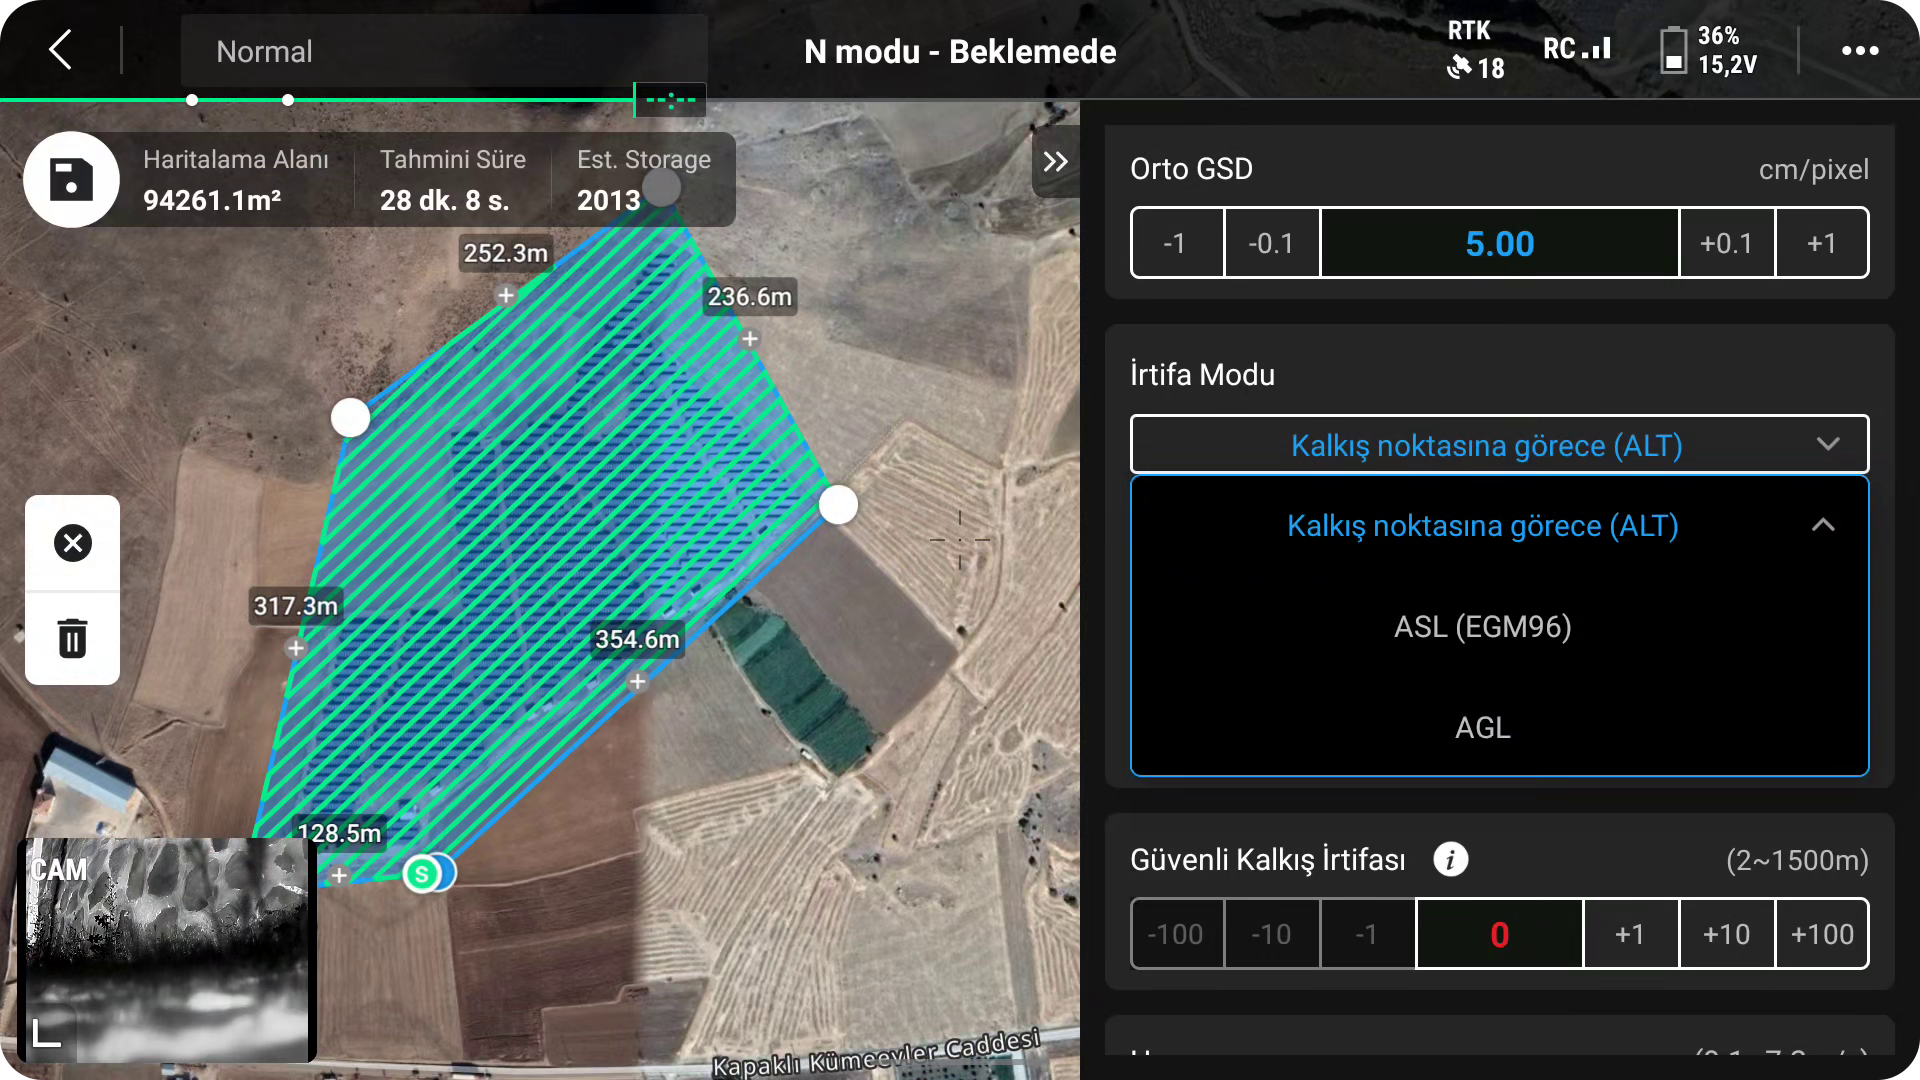
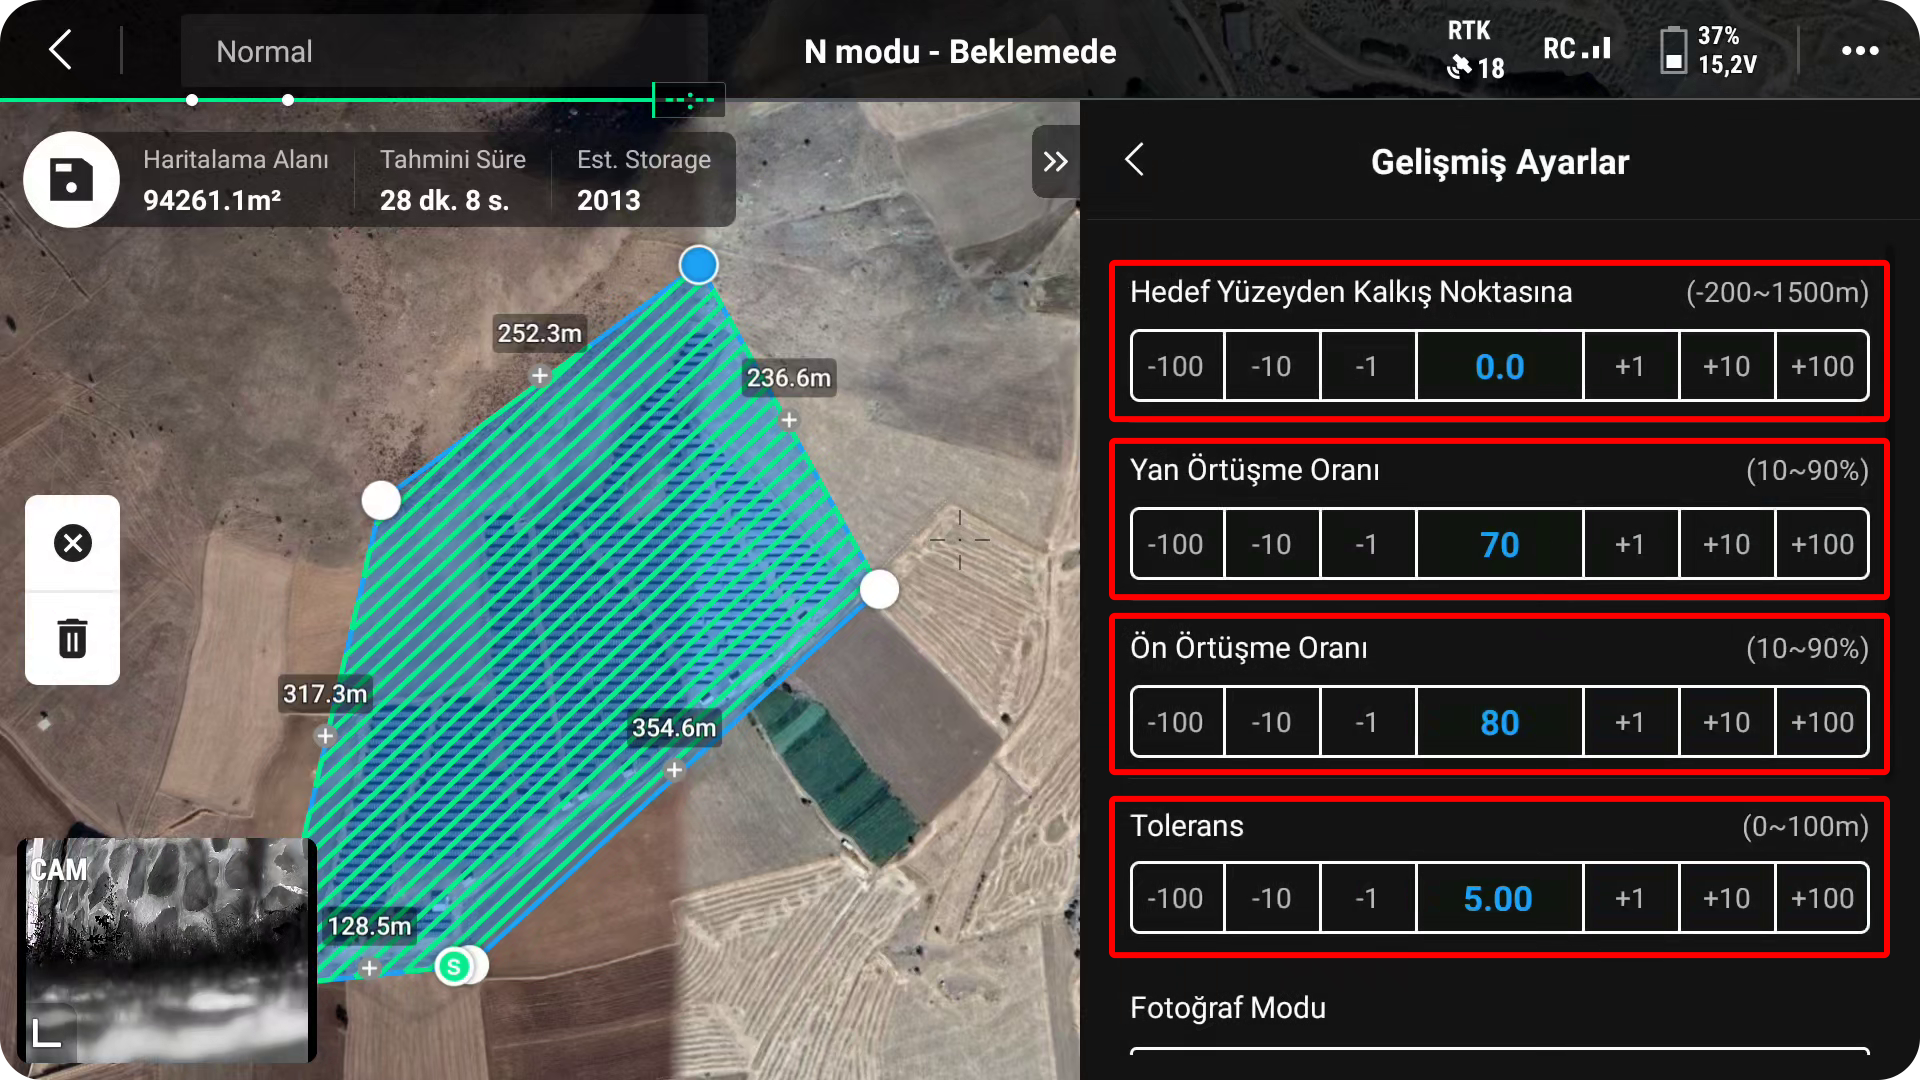
- Click on “Settings” in the upper right corner and set the following parameters:
- Altitude: As previously selected, according to your service package.
- Front Overlap: 70%.
- Side Overlap: 70%.
- Gimbal Orientation: Standard Nadir (-90 degrees).

- Click “Save” to save the settings.
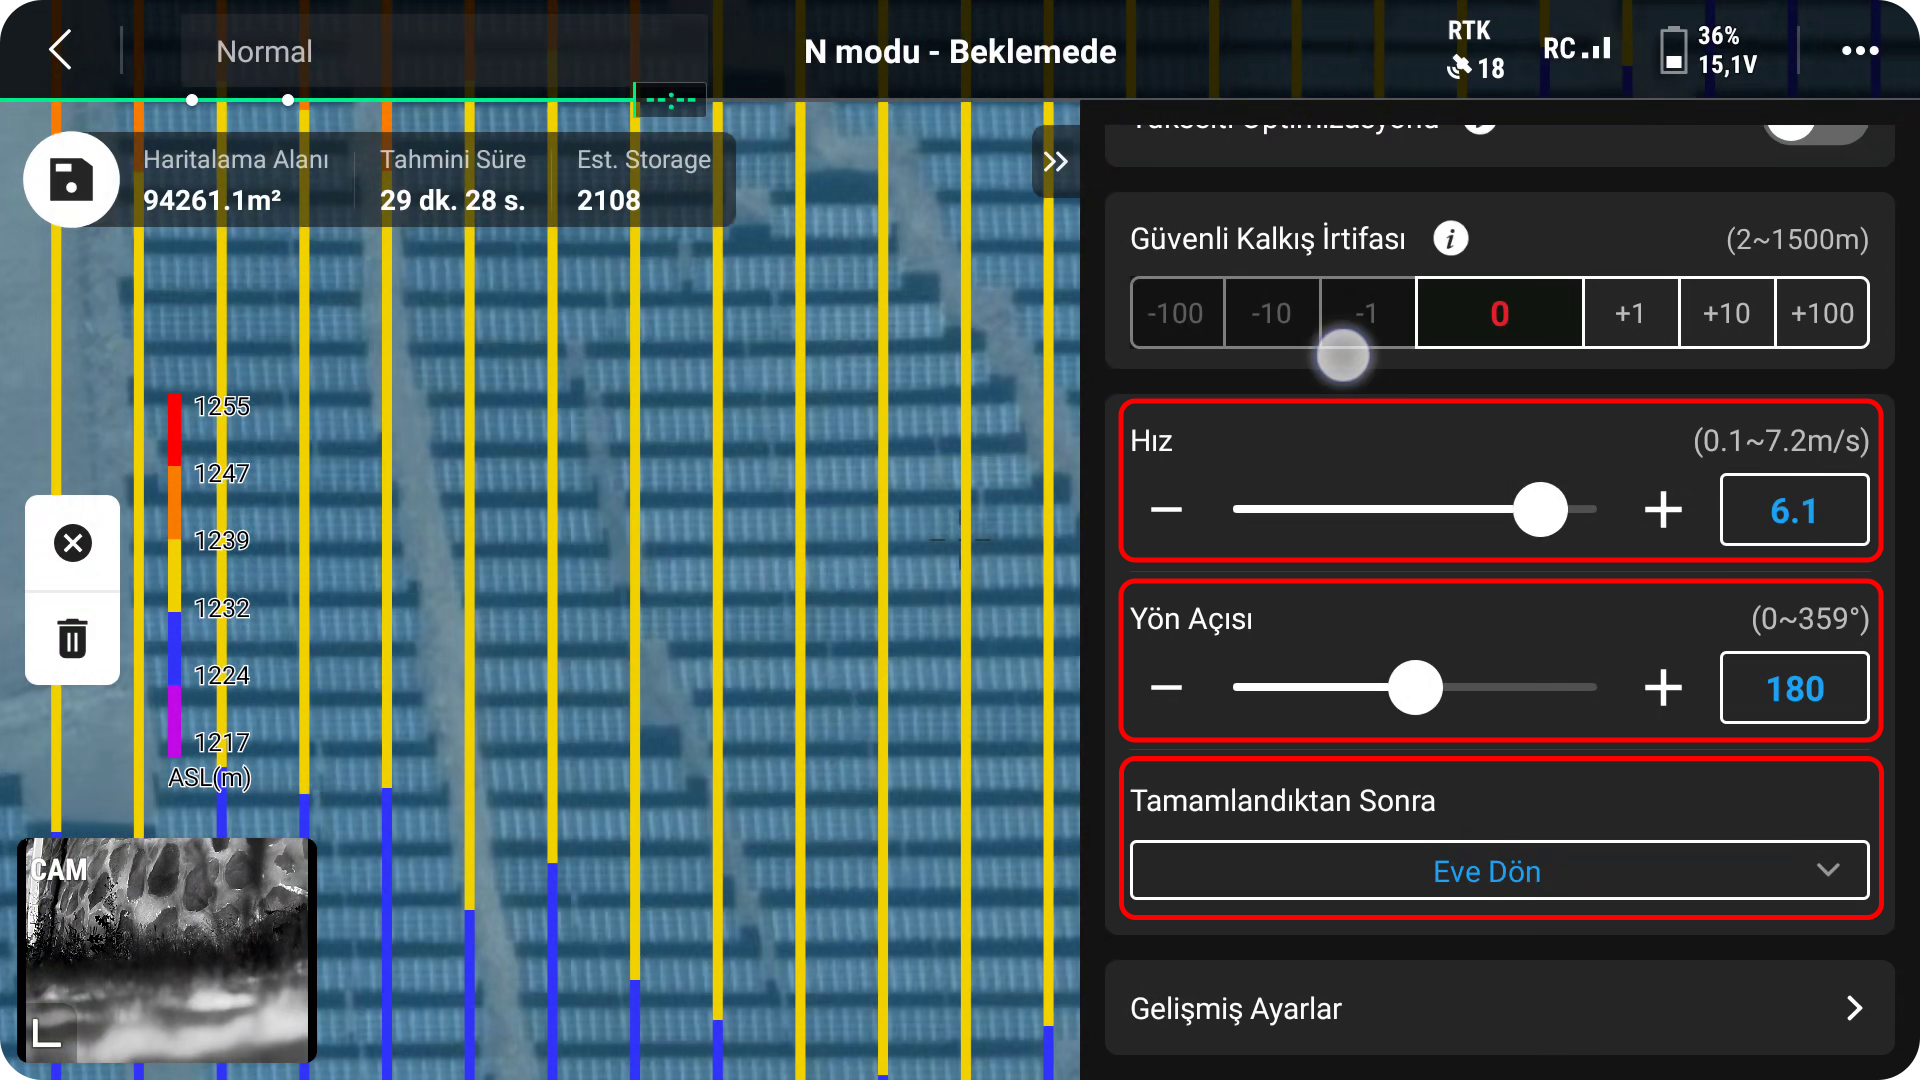
 Flight Start:
- After confirming the settings, click “Start” to begin the flight.
- During the flight, monitor the drone to ensure the camera is capturing the images according to the set parameters.
What is GSD? How is it Used?#
Ground Sampling Distance (GSD) is a term used in photography and remote sensing technology, referring to the size of the real area each pixel of a photo or image covers on the Earth’s surface. In simple terms, GSD indicates how much area a pixel in an image represents on the ground. The measurement unit is usually meters or centimeters. The lower the GSD value, the more detailed the image.
The Importance of GSD
GSD is an indicator of image resolution and determines how detailed an area can be displayed. In high-resolution images, the GSD value is low, which means more details can be seen. Therefore, accurate calculation and optimization of GSD is essential in many applications, such as land mapping, urban planning, agriculture, construction monitoring, and environmental observation.
Calculation of GSD Values and Practical Examples
Calculating the GSD value is a process that considers the resolution of images taken by drones or satellites and the characteristics of the camera used. The formula for GSD calculation is as follows:
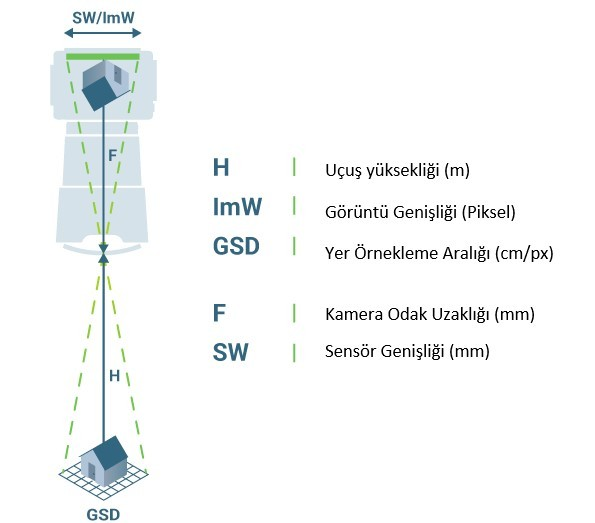
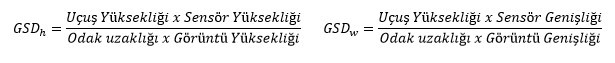
In this formula:
Flight Height: The altitude of the drone above the ground, expressed in meters.
Sensor Width: The physical width of the camera sensor, expressed in millimeters.
Image Width: The width dimension of the total number of pixels in the image, expressed in pixels.
Focal Length: The focal length of the camera lens, expressed in millimeters.
Understanding the effects of GSD (Ground Sample Distance) and flight height on a detailed examination of a solar plant is essential for efficient and cost-effective inspections. Thermal imaging conducted using drones plays an important role in assessing the condition of solar panel systems. In this process, determining the correct GSD value directly affects the level of detail in the obtained images and makes the selection of the appropriate flight height for the inspection’s purpose critical.
The tables below compare the recommended flight heights for different GSD values and their intended uses in solar panel inspections:
Mavic 3T Camera | GSD | ||
3.0 ± 0.5 cm/pixel | 5.0 ± 0.5 cm/pixel | 7.0 ± 0.5 cm/pixel | |
H20T | 33.8m ± 5.7m | 56.3m ± 5.7m | 78.8m ± 5.7m |
M30T | 22.7m ± 3.8m | 37.9m ± 3.8m | 53.1m ± 3.8m |
M3T | 22.7m ± 3.8m | 37.9m ± 3.8m | 53.1m ± 3.8m |
GSD Value (cm/pixel) | Detail Level | Flight Height (m) | Inspection Type |
7.0 ± 0.5 | Low | High ( | General Solar Module Inspection |
5.0 ± 0.5 | Medium | Medium | Cell and Cell Anomalies Inspection |
3.0 ± 0.5 | High | Low | Comprehensive Inspection in Compliance with IEC Standards |
- General Solar Panel Scanning (7.0 ± 0.5 cm/pixel): Initial level inspection suitable for quickly scanning large areas. High-altitude flights provide a wide field of view, but produce less detailed images.
- Solar Cell Anomalies Inspection (5.0 ± 0.5 cm/pixel): Ideal for detecting potential issues at the cell level with medium detail. This GSD allows for even the smallest anomalies in solar cells to be noticed.
- Detailed and Comprehensive Solar Inspection (3.0 ± 0.5 cm/pixel): This level is necessary for detailed thermal inspections and temperature measurements in accordance with IEC standards. This GSD ensures that even the smallest anomalies in solar panels and cells are identified in compliance with internationally accepted standards.
This assessment shows that selecting the correct GSD and flight height has a significant impact on the accuracy and efficiency of solar panel inspections. Choosing the appropriate GSD value and flight height according to the defined objectives optimizes costs and enhances the quality of the inspection. This makes the inspection process more efficient, allowing solar plants to operate at maximum performance.
Drone Models#
MapperX supports various drone models for high-precision and fast data collection. Supported drone models include the DJI Mavic 3 Enterprise Thermal, DJI Matrice 350 + H20T, and DJI Matrice 30 Thermal. These drones enable comprehensive and detailed inspections in solar energy plants thanks to their thermal and RGB imaging capabilities.
DJI Mavic 3 Enterprise Thermal (M3T)#
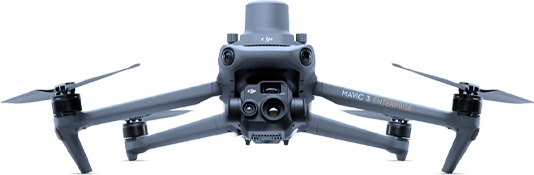
The DJI Mavic 3 Enterprise Thermal (M3T) is a compact and portable drone model equipped with thermal and RGB imaging capabilities. Designed primarily for industrial applications and inspections, the M3T stands out with high-resolution imaging, precise data collection, and fast operational capacity.
Technical Specifications
- Thermal Camera: 640×512 resolution, 30Hz refresh rate, ±2°C temperature accuracy
- RGB Camera: 20MP resolution, 4/3 CMOS sensor, 56x maximum zoom (28x hybrid zoom)
- Laser Range Finder: Range up to 1200 meters
- Flight Time: Maximum 45 minutes
- Wind Resistance: Resistant to wind speeds up to 12 m/s
- Precise Positioning: GNSS (GPS, GLONASS, Galileo) supported precise positioning
- Operating Temperature: Wide operating temperature range from -20°C to 50°C
- IP Rating: IP45 water and dust resistance rating
Areas of Use
The DJI Mavic 3 Enterprise Thermal (M3T) can be used in a wide range of industrial and commercial applications. It excels in high-resolution thermal and RGB imaging capabilities for thermal inspections in solar power plants, infrastructure assessments, search and rescue operations, firefighting, and agriculture.
- Solar Power Plants: Quickly and accurately identifying faulty panels by detecting temperature distributions
- Infrastructure Inspections: Thermographic examinations of bridges, buildings, and other structural elements
- Search and Rescue: Detecting and locating missing persons through thermal imaging
- Firefighting: Monitoring the spread of fires and identifying hotspots
- Agriculture: Monitoring plant health and enhancing agricultural productivity through thermal and RGB imaging
The DJI Mavic 3 Enterprise Thermal (M3T) provides fast and efficient data collection in field operations with its portability, long flight time, and superior imaging capabilities. With these features, it delivers reliable and precise measurements even in challenging environmental conditions, offering significant operational advantages to its users.
DJI Matrice 30T (M30T)#
DJI Matrice 30T (M30T) – English
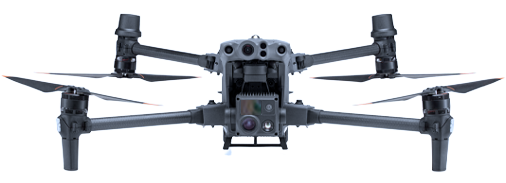
The DJI Matrice 30T (M30T) is an advanced drone model designed for industrial and commercial applications. This drone is equipped with a high-resolution RGB camera and a thermal camera with a resolution of 640×512 pixels. The M30T provides the ability to inspect large areas and distant locations in detail, with 16x digital zoom and 8x optical zoom features.
- Thermal Camera: 640×512 resolution, 30Hz refresh rate, ±2°C temperature accuracy
- RGB Camera: 48MP resolution, 1/2″ CMOS sensor, 16x digital zoom and 8x optical zoom
- Flight Time: Maximum 41 minutes
- Wind Resistance: Capable of withstanding wind speeds up to 15 m/s
- Precision Positioning: Centimeter-level accuracy with RTK (Real-Time Kinematic) module
- IP Rating: IP45 water and dust resistance rating
- Operating Temperature: Wide operating temperature range between -20°C and 50°C
The DJI Matrice 30T provides reliable performance even in challenging environmental conditions, thanks to its advanced sensor technology and durable design. It stands out in thermal and visual inspections of large areas, such as solar power plants, with high accuracy and detailed data collection capabilities. With these features, the M30T is widely used in various industrial applications, including thermographic inspection, mapping, search, and rescue operations.
DJI Matrice 30T (M30T)#
DJI Matrice 30T (M30T) – English
The DJI Matrice 30T (M30T) is an advanced drone model designed for industrial and commercial applications. This drone is equipped with a high-resolution RGB camera and a thermal camera with a resolution of 640×512 pixels. The M30T provides the ability to inspect large areas and distant locations in detail, with 16x digital zoom and 8x optical zoom features.
- Thermal Camera: 640×512 resolution, 30Hz refresh rate, ±2°C temperature accuracy
- RGB Camera: 48MP resolution, 1/2″ CMOS sensor, 16x digital zoom and 8x optical zoom
- Flight Time: Maximum 41 minutes
- Wind Resistance: Capable of withstanding wind speeds up to 15 m/s
- Precision Positioning: Centimeter-level accuracy with RTK (Real-Time Kinematic) module
- IP Rating: IP45 water and dust resistance rating
- Operating Temperature: Wide operating temperature range between -20°C and 50°C
The DJI Matrice 30T provides reliable performance even in challenging environmental conditions, thanks to its advanced sensor technology and durable design. It stands out in thermal and visual inspections of large areas, such as solar power plants, with high accuracy and detailed data collection capabilities. With these features, the M30T is widely used in various industrial applications, including thermographic inspection, mapping, search, and rescue operations.
DJI Matrice 300 + H20T / H20N#
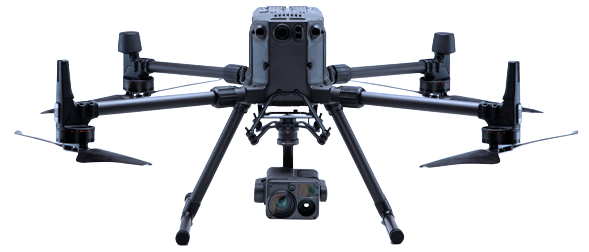
The DJI Matrice 300 RTK (M300 RTK) is one of the most powerful and versatile drone platforms developed for industrial and commercial applications. When combined with the integrated H20T and H20N cameras, the M300 RTK offers superior imaging and data collection capabilities.
DJI Matrice 300 RTK Features
- Flight Time: Maximum 55 minutes
- Wind Resistance: Resistant to wind speeds up to 15 m/s
- Range: Control range of up to 15 km
- Precise Positioning: Centimeter-level accuracy with the RTK (Real-Time Kinematic) module
- IP Rating: IP45 water and dust resistance rating
- Operating Temperature: Wide operating temperature range between -20°C and 50°C
- Multiple Payload Capacity: Capacity to carry three different payloads simultaneously
DJI Zenmuse H20T Camera Features
- Thermal Camera: 640×512 resolution, 30Hz refresh rate, ±2°C temperature accuracy
- RGB Camera: 20MP resolution, 23× hybrid zoom (200× maximum zoom)
- Laser Range Finder: Range of up to 1200 meters
- IP Rating: IP44 water and dust resistance rating
- Multispectral Camera: Multispectral data with high accuracy
DJI Zenmuse H20N Camera Features
- Night Vision Camera: High precision low-light performance
- Thermal Camera: Dual thermal camera (2x 640×512 resolution) for high accuracy temperature measurements
- Laser Range Finder: Range of up to 1200 meters
- RGB Camera: 20MP resolution, 23× hybrid zoom (200× maximum zoom)
- IP Rating: IP44 water and dust resistance rating
Applications
The combination of the M300 RTK with the H20T/H20N cameras is an excellent solution for thermographic inspections, search and rescue operations, infrastructure inspections, and mapping studies in large-scale industrial facilities like solar power plants. The high-resolution thermal and RGB imaging capabilities, precise positioning with the integrated RTK module, and long flight time make this drone and camera combination ideal for fast and reliable data collection.
DJI Matrice 350 + H30T#
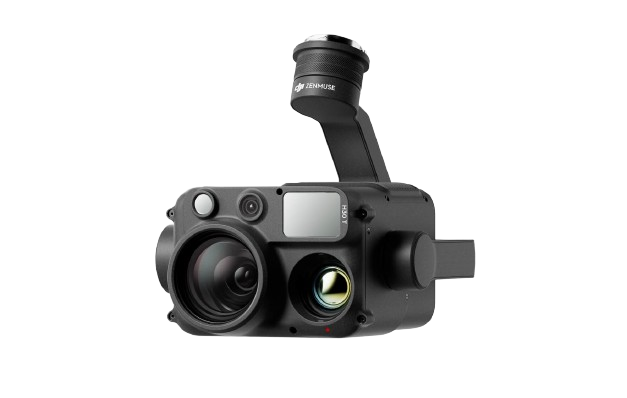
The combination of the DJI Matrice 350 RTK (M350 RTK) and the Zenmuse H30T camera provides a high-performance solution with advanced imaging and data collection capabilities. This system is particularly ideal for industrial inspections and demanding operational tasks.
DJI Matrice 350 RTK Features
- Flight Time: Maximum 55 minutes
- Wind Resistance: Resistant to wind speeds up to 15 m/s
- Range: Control range of up to 15 km
- Precise Positioning: Centimeter-level accuracy with RTK (Real-Time Kinematic) module
- IP Rating: IP45 water and dust resistance rating
- Operating Temperature: Wide operating temperature range from -20°C to 50°C
- Multi-Payload Capacity: Capable of carrying three different payloads simultaneously
DJI Zenmuse H30T Camera Features
- Product Name: Zenmuse H30 Series
- Dimensions: 170×145×165 mm (L×W×H)
- Weight: 920±5 g
- Power: H30: 26 W, H30T: 28 W
- Ingress Protection Rating: IP54
- Supported Aircraft: Matrice 300 RTK, Matrice 350 RTK
- Operating Temperature: -20°C to 50°C
- Storage Temperature: -20°C to 60°C
- Stabilization System: 3-axis (Pitch, Yaw, Roll)
- Angular Vibration Range: Pitch: ±0.002°, Flight: ±0.004°
- Mounting: Detachable DJI SKYPORT
- Mechanical Range: Pitch: -132.5° to +73°, Yaw: ±60°, Roll: ±328°
- Controllable Range: Pitch: -120° to +60°, Roll: ±320°
- Operation Mode: Follow/Free/Center
Infrared Thermal Camera (H30T)
- Thermal Imager: Uncooled VOx Microbolometer
- Lens: Focal Length: 24 mm, Equivalent Focal Length: 52 mm, Aperture: f/0.95, DFOV: 45.2°, Digital Zoom Equivalent: 32×
- Video Resolution: 1280×1024@30fps
- Video Format: MP4
- Video Subtitles: Supported
- Video Codec Component and Bit Rate Strategy: H.264, H.265; CBR, VBR
- Photo Resolution: 1280×1024
- Photo Format: R-JPEG
- Pixel Pitch: 12 microns
- Spectral Band: 8-14 microns
- Noise Equivalent Temperature Difference (NETD): ≤ 50 mk@f/1.0
- Temperature Measurement Method: Point Measurement, Area Measurement, Center Point Temperature Measurement
- Temperature Measurement Range:
- High Gain: -20° to 150° C (-4° to 302° F), -20° to 450° C (-4° to 842° F) (With Infrared Density Filter)
- Low Gain: 0° to 600° C (32° to 1112° F), 0° to 1600° C (32° to 2912° F) (With Infrared Density Filter)
- Temperature Warning: Supported
- Sunburn Protection: Supported
- FFC: Automatic, Manual
- Palette: White Hot, Black Hot, Color Tone, Iron Red, Rainbow 1, Rainbow 2, Medical, Arctic, Fulgurite, Hot Iron